What Soil Organic Carbon Is Worth to Prairie Crop Yields
Soil organic carbon (SOC) is usually talked about as a climate lever: increasing SOC as a technique to mitigate climate change. That is real, and it is why soil carbon sits at the centre of so many agricultural carbon programs. But for the person actually farming the land, there is a more immediate question does more soil carbon grow more crop? And if so, how much more, and where does it matter most?
I set out to answer that at provincial scale for the four crops that dominate Saskatchewan: hard red spring wheat, barley, canola, and field peas.
Mapping the carbon first
You cannot study something you cannot measure everywhere, so the first step was a wall-to-wall map of topsoil organic carbon. I combined 5014 historical soil samples with satellite imagery, climate data, and terrain information, and trained a machine-learning model (a random forest) to predict SOC across the whole agricultural region at 250 m resolution. The result is the map below.
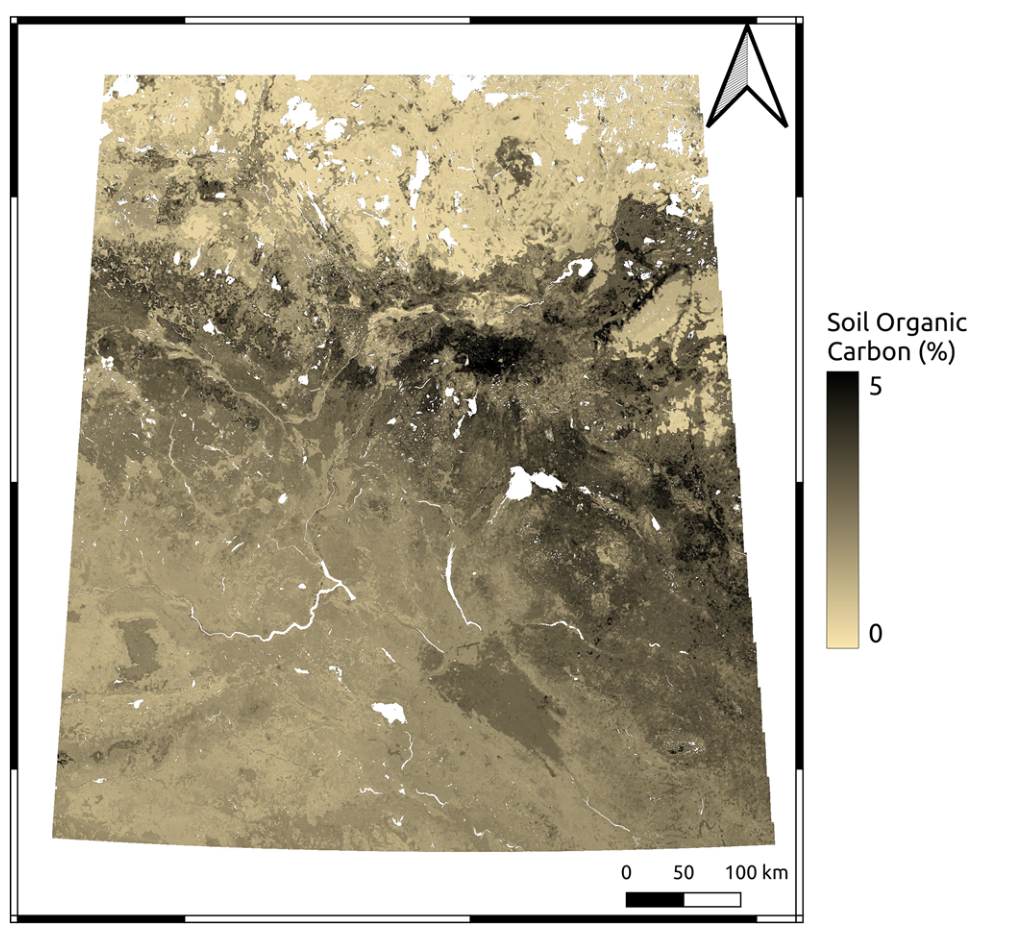
The model held up against independent test data (R-squared of 0.48, concordance correlation of 0.67). Solid performance for regional soil mapping built largely from legacy samples and open satellite archives.
Linking carbon to yield
With the map in hand, I paired it against crop insurance yield records - between 100,000 and 200,000 records per crop - and used a mixed- effects model that normalized both carbon and yield within each rural municipality. That normalization is the important part: it strips out the broad climate gradients that drive both SOC and yield in the same direction, so what remains is much closer to the effect of carbon itself rather than the effect of a wetter or cooler region.
The relationship was clear and positive for all four crops. A one percentage point increase in SOC was associated with, on average:
- Wheat: +263 kg/ha (about 7.9%)
- Barley: +293 kg/ha (about 8.2%)
- Canola: +133 kg/ha (about 5.6%)
- Field peas: +135 kg/ha (about 5.5%)
At the commodity prices used in the study, that works out to roughly $4,000 to $5,200 in additional revenue per quarter section for every one-point gain in SOC, depending on the crop. The cereals responded most strongly; peas the least, which fits their biology, as a legume fixing its own nitrogen, peas are less dependent on the nitrogen that richer soils supply.
Where it pays the most
The headline averages hide the most useful finding for anyone deciding where to invest in soil health: the returns are largest on the poorest soils. Yield response to increasing carbon contents was strongest in areas with lower starting SOC (roughly the 2 to 2.5% range) and tapered off as soils got richer, with the response flattening above SOC contents of about 3%. In other words, the same tonne of carbon buys more yield on a depleted soil than on an already-carbon-rich one.
Why this matters beyond the farm gate
The main takeaway from this work is that while much of the conversation on practices that build soil carbon (reduced tillage, cover cropping, better rotations) have been focused on sequestration, there is a real yield benefit from increasing SOC.
This article summarizes: Sorenson, P. T., Shirtliffe, S., & Bedard-Haughn, A. K. (2024). Examining the effect of soil organic carbon on major Canadian Prairie crop yields with predictive soil mapping. Agronomy Journal. https://doi.org/10.1002/agj2.21704